

Trusted AI-powered analytics - informed by Databricks.
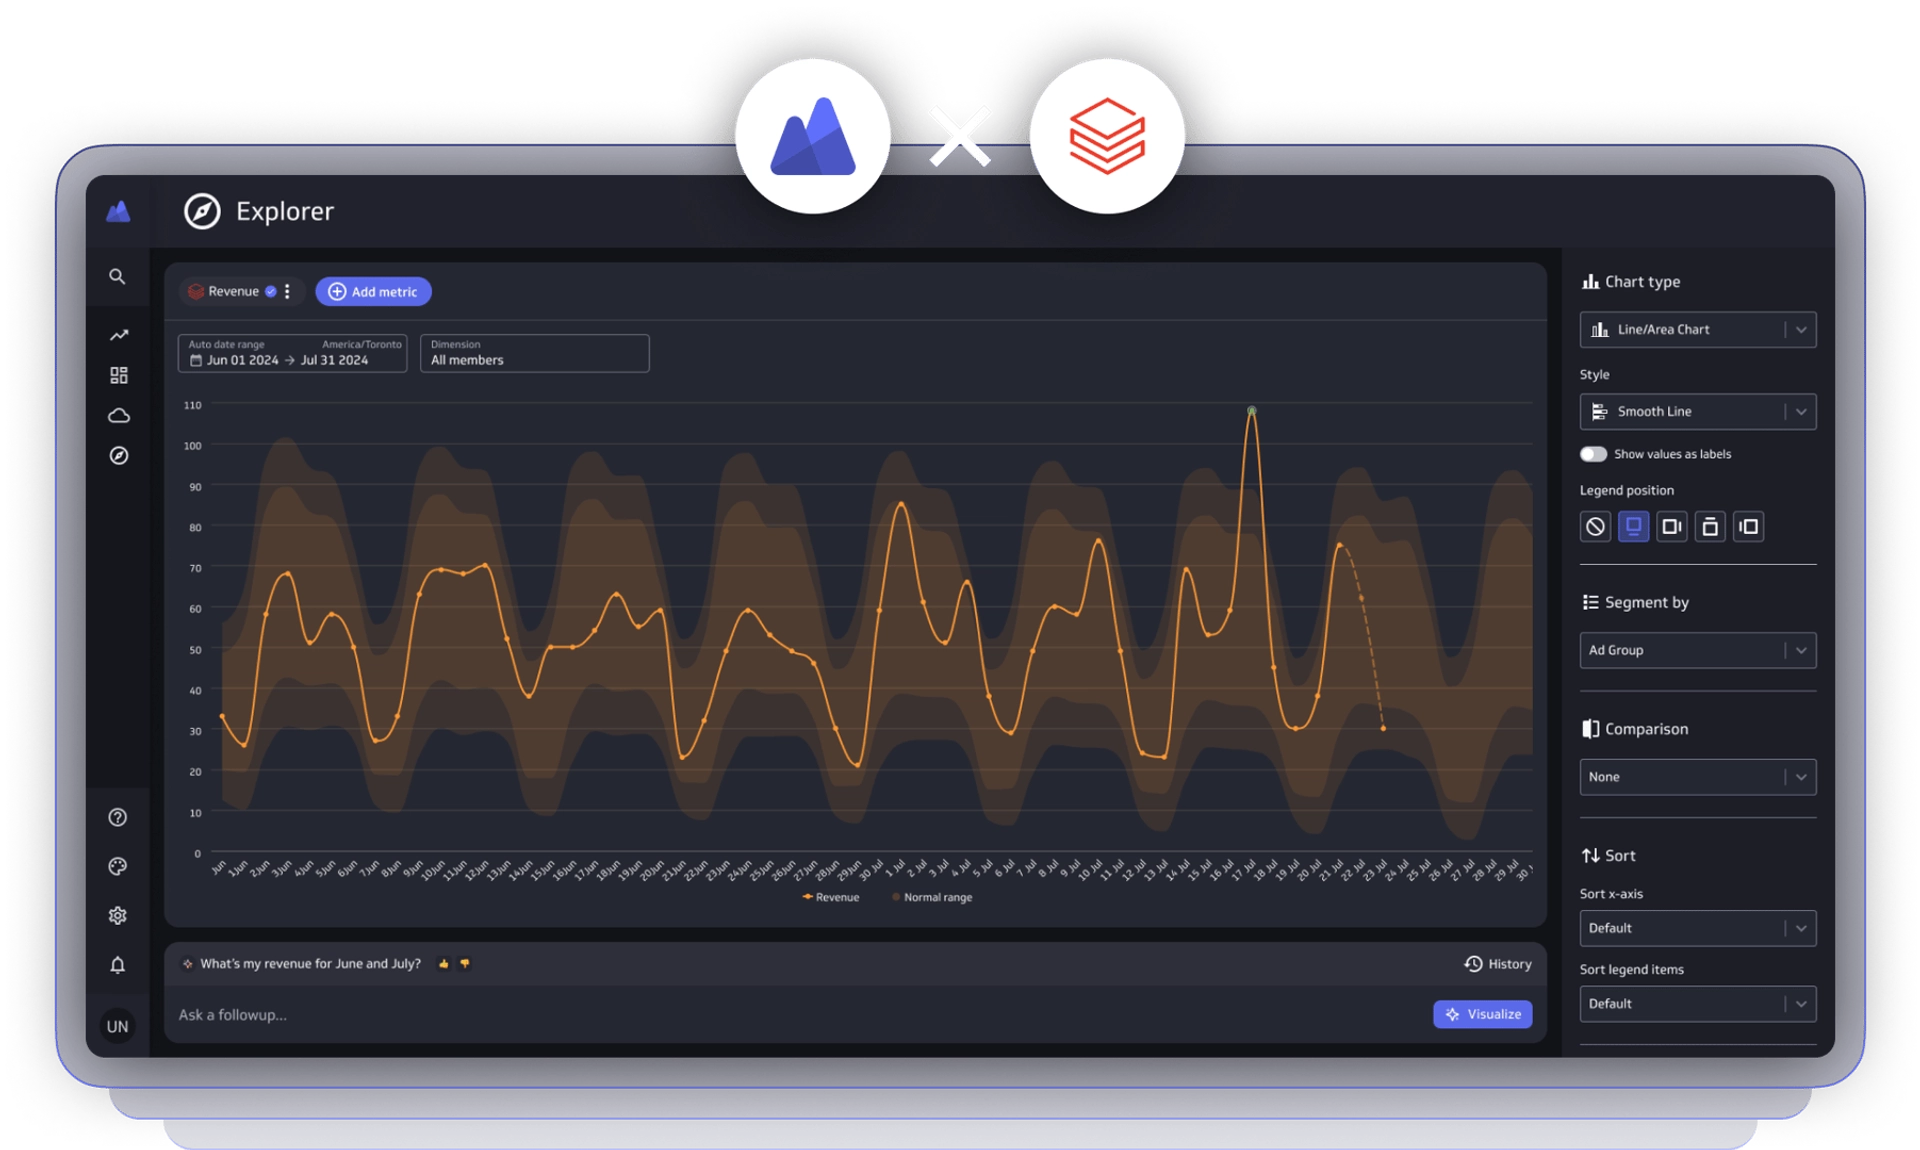
PowerMetrics transforms your Databricks Lakehouse into a governed, business-ready metric catalog. Define metrics once and publish them to a curated library that every team can explore with confidence—no SQL required.
Recognized as a front runner (Software Advice), a high performer (G2), and a category leader (GetApp) in Analytics and Business Intelligence.
How to connect to Databricks
See how to connect to any supported data warehouse - including Databricks - and visualize your data as metrics.
PowerMetrics transforms your Databricks Lakehouse into a governed, business-ready metric catalog. Instead of asking teams to navigate complex Delta Lake schemas or write SQL, PowerMetrics lets you define metrics once and publish them to a curated library that everyone—from the CEO to the analyst—can explore with confidence.
Why Databricks teams need a metrics layer
Databricks excels at unifying data engineering, AI, and data science at scale. But the "final mile"—getting those insights to non-technical business users—often remains a challenge. Your gold-layer tables are powerful, but they're not enough on their own.
The Databricks challenge
Fragmented metric logic
Metric definitions live in different places: some in dbt models, some in Spark notebooks, others in gold-layer tables. When the CEO asks for "net revenue," three teams might give three different answers.
Complexity vs. accessibility
Delta Lake is built for data engineers. Asking a marketing manager to navigate Spark clusters or write SQL warehouses queries is unrealistic—and expensive when casual queries consume DBUs.
Costly "always-on" queries
Running SQL Warehouses for repetitive business questions drives unnecessary Databricks Unit consumption and slows decision-making.
The technical wall
Without a semantic layer, non-technical users are blocked. They depend on data teams to translate questions into queries, creating bottlenecks and delays.
How PowerMetrics solves it
| Challenge | PowerMetrics Solution |
|---|---|
| Logic scarcity | Unified semantic layer: consolidate logic from notebooks and SQL editors into a single, governed metric catalog. Define Net_Revenue once; use it everywhere. |
| DBU optimization | Smart query routing: PowerMetrics acts as an intelligent buffer, reducing the frequency of small, expensive "ping" queries to your SQL Warehouses. |
| The technical wall | Democratized discovery: transform complex Delta Lake schemas into a simple, searchable library of metrics that any business user can explore via AI or drag-and-drop. |
| Fragmented answers | Single source of truth: one metric definition, many uses. The catalog keeps names, formulas, and filters consistent across every dashboard, report, and conversation. |
Key benefits
Create metrics directly from Databricks
Query tables or views and turn results into governed metrics in minutes. No complex BI setup required. Map your gold-layer data straight into PowerMetrics and skip the translation layer.
Built for scale
Handle large datasets while using your Databricks controls for performance and concurrency. PowerMetrics respects your warehouse architecture and security model.
Trusted by design
One metric definition, many uses. The catalog keeps names, formulas, and filters consistent across dashboards, AI conversations, and exports.
True self-serve
Data teams keep the keys. Define the connection and the logic once. Business users explore safely through a governed interface—no raw data access, no SQL required.
Mix and match
Use Databricks metrics alongside metrics from other warehouses, semantic layers (like dbt or Cube), or service APIs. Combine them to create calculated metrics that span your entire data ecosystem.
AI that stays grounded
Get visualizations and natural-language explanations based on governed metrics and source-backed responses. Our AI uses your Databricks-backed logic to deliver accurate, auditable insights.
From Delta tables to decision metrics
Map your Databricks gold layer directly to PowerMetrics. Skip the complex BI setup and turn your refined tables into governed, version-controlled metrics in minutes. Data teams control the connection and the logic; business teams get a safe environment to explore without breaking the pipeline.
For data engineers
Focus on the Lakehouse, not the dashboard. Ship a metric catalog once and stop translating business questions into SQL and Spark queries. Your Databricks pipeline becomes the source of truth; PowerMetrics becomes the interface.
For business insights teams
Access the power of the world's most advanced data platform through a simple, conversational interface. No notebooks, no code, just answers. Ask questions in plain language and get results backed by your Databricks source of truth.
AI-ready infrastructure
Leverage Databricks for the heavy data lifting and PowerMetrics for the AI-powered interface. Our AI uses your Databricks-backed logic to provide accurate, natural-language answers grounded in governed metrics—not generic guesses.
In a Databricks environment, AI is the future. But generic AI can't read your Delta Lake or understand your business context. PowerMetrics grounds our AI assistant in your governed metric definitions, ensuring that every insight provided is technically accurate and auditable.
Turn your Lakehouse into a lighthouse. Use Databricks for the scale and PowerMetrics for the clarity.
Get started
Ready to unlock your Databricks data? Connect your warehouse, define your first metric, and invite your team to explore. Want to see it in action? Watch our webinar on getting metrics-ready with your existing data stack.
Learn more
